Enzyme pH Lab Report
Enzyme Lab Report Testing pH
Jessica Serrano
Sydney Stitt
Grace Slone
Leah Chiponis
11/20/17
Abstract
From our introduction to our conclusion, you can see how much we learned, how we recorded data, our procedure, and all of our effort into this lab. The purpose of this lab was to show how different pH levels reacted with hydrogen peroxide and grass extract, each having a different outcome. We found that the higher the pH, the faster and larger the froth grew, and the lower the pH was, the slower it took the froth to grow. 3 pH did not even grow at all. It was significant to see how if hydrogen peroxide and different acids and bases were combined with our plant, there would be results that would vary. Our introduction covers our thoughts and opinions about the lab before we performed it, the materials section shows everything that was needed in the lab, and the procedure reveals all of our steps and how we performed the lab. The results section displays our observations, and the measurements of the amount of froth in millimeters, the discussion shows how we all felt about the lab and ways we could have improved, and our conclusion sums up just about everything in our lab.
Introduction
This experiment was tested so we could see how different pH levels react with a mix of both grass and hydrogen peroxide. We used this experiment so we could see how enzymes changed and reacted to different substances. We used buffer solutions so we could easily change the pH level of each mixture, and how the mixed solution with the grass extract changed, grew, or separated. We performed this lab to show how an enzyme, or hydrogen peroxidase, at different pH levels had a rate of reaction that differed due to pH. Our process was to measure out 1 mL of each solution, with grass extract, hydrogen peroxide, and a varying pH, to create about 5 solutions with a different pH that we could measure, record, and compare to see what each pH produced. Our hypothesis was if there are different visual reactions with hydrogen peroxide, grass extract, and multiple pH solutions, then enzymatic reactions can be dependent upon the pH level. We predicted that each pH level would have a different rate of reaction, but in the end, pH 8 and 9 both overflowed the test tube, surprising our group.
Materials and Methods
Materials:
- Dropper
- Paper towels ( for filteration)
- Distilled Water
- Ruler
- Safety Glasses
- Digital Balance (scale )
- Hydrogen Perioxde
- Glass Test Tubes
- Test Tube Rck or Holder
- 1 mL syringe
- Buffers of 3, 5, 7, 8 and 9 pH levels
- 9 glass beakers.
Experimental Procedure
First we gathered about 8.5 grams of grass, 9 test tubes, a tray, a 1mL syringe, 5 different types of buffers, distilled water, a ruler, safety glasses, and hydrogen peroxide.
- First, we took three test tubes, and put 1 mL of grass extract, mL of hydrogen peroxide, and 1 mL of water mixed in each of them. 5 minutes later, check the froth and it will end up to be about 14 mL
- Next, we took five test tubes and put 1 mL of hydrogen peroxide in each, 1 mL of grass extract in each, and finally, 1 mL of 3pH buffer solution in the first tube.
- We then recorded the amount of millimeters of the froth grown in that solution with the 3pH buffer solution.
- Next, after recording the data of the 3 pH buffer solution, with the second test tube, we placed 1mL of 5pH buffer in the second tube,
- After that, we recorded the amount of froth grown, in millimeters, every minute up to five minutes for the 5 pH buffer solution.
- Then, after recording the data of the 5 pH buffer solution, with the third test tube, we placed 1mL of 7pH buffer in the third tube,
- After that, we recorded the amount of froth grown, in millimeters, every minute up to five minutes for the 7 pH buffer solution.
- Then, after recording the data of the 7 pH buffer solution, with the fourth test tube, we placed 1mL of 8pH buffer in the fourth tube,
- After that, we recorded the amount of froth grown, in millimeters, every minute up to five minutes for the 8 pH buffer solution.
- Then, after recording the data of the 7 pH buffer solution, with the fifth test tube, we placed 1mL of 9pH buffer in the fifth tube,
- After that, we recorded the amount of froth grown, in millimeters, every minute up to five minutes for the 9 pH buffer solution.
- Finally, we created a chart showing all of the buffers and solutions, and in one minute intervals, each amount of froth from each one in millimeters was recorded.
Results:
Graph Showing the Froth Growth for Each Solution.
For Graph: Light Green = Water solution, Purple = 3pH, Orange = 5pH, Red = 7pH,
Blue = 8 pH, and Dark Green = 9pH


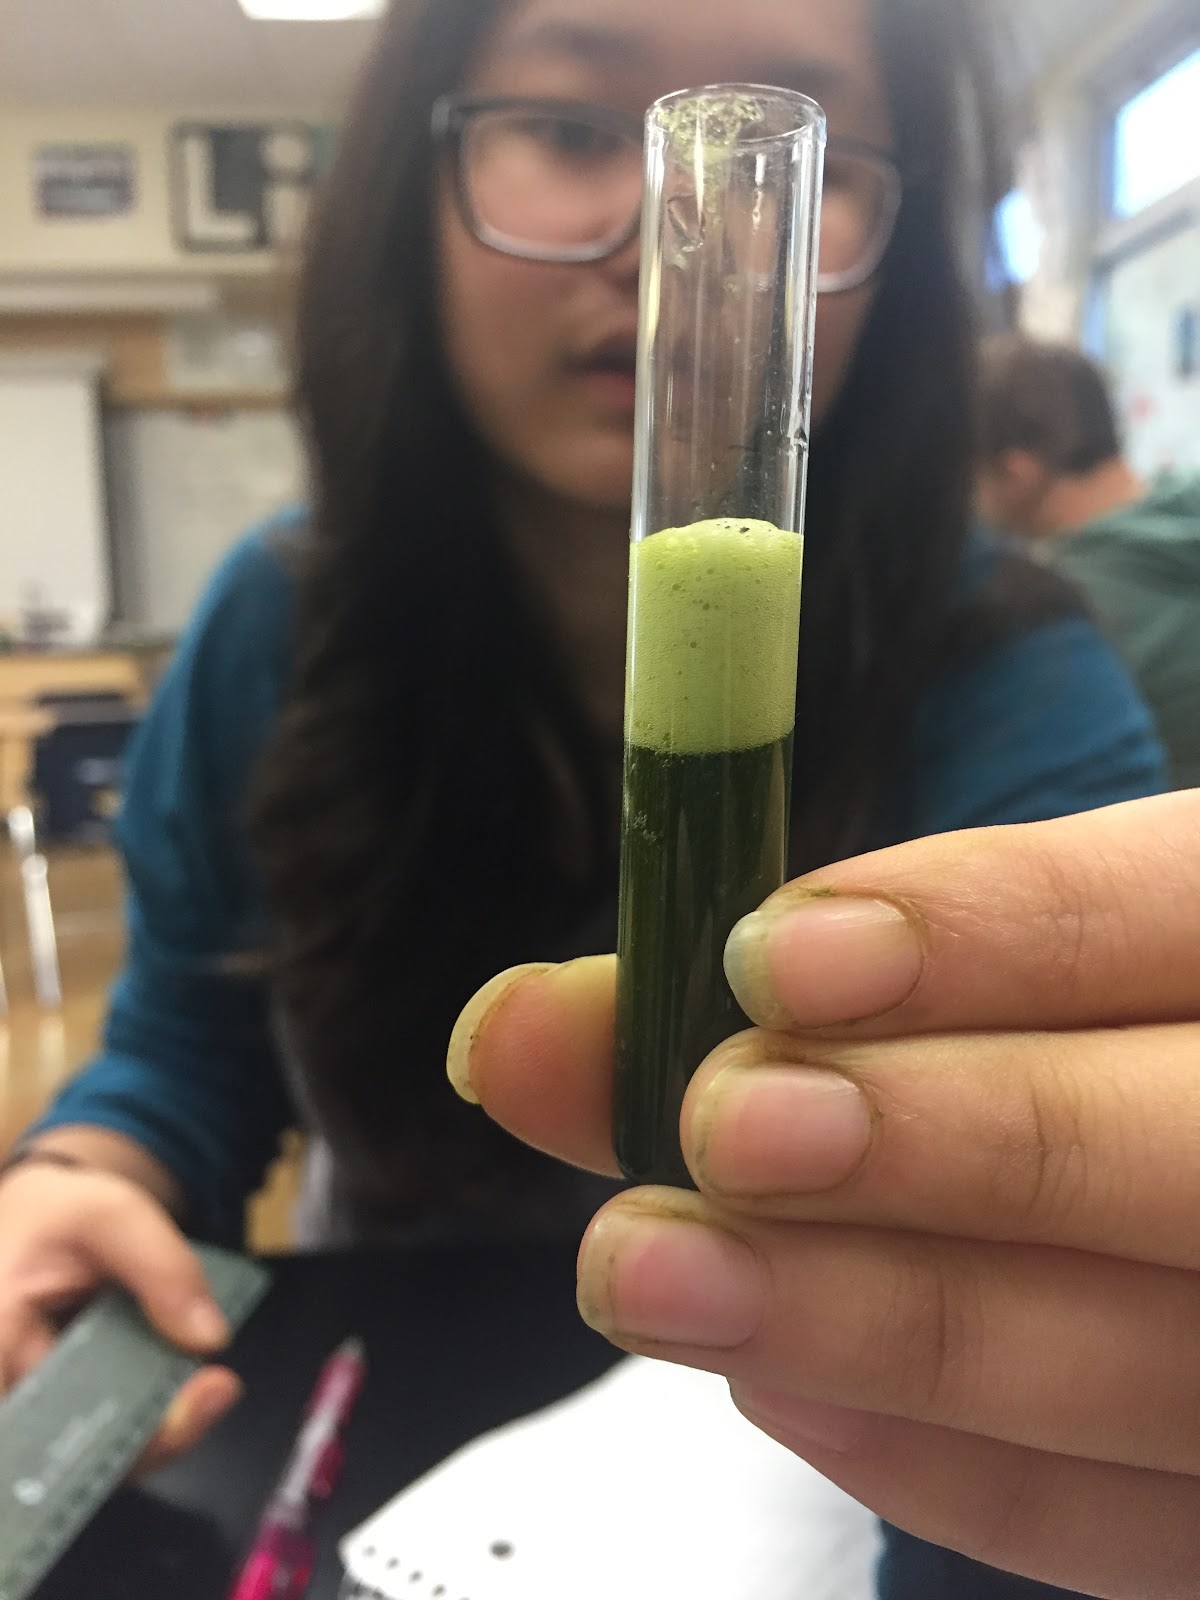
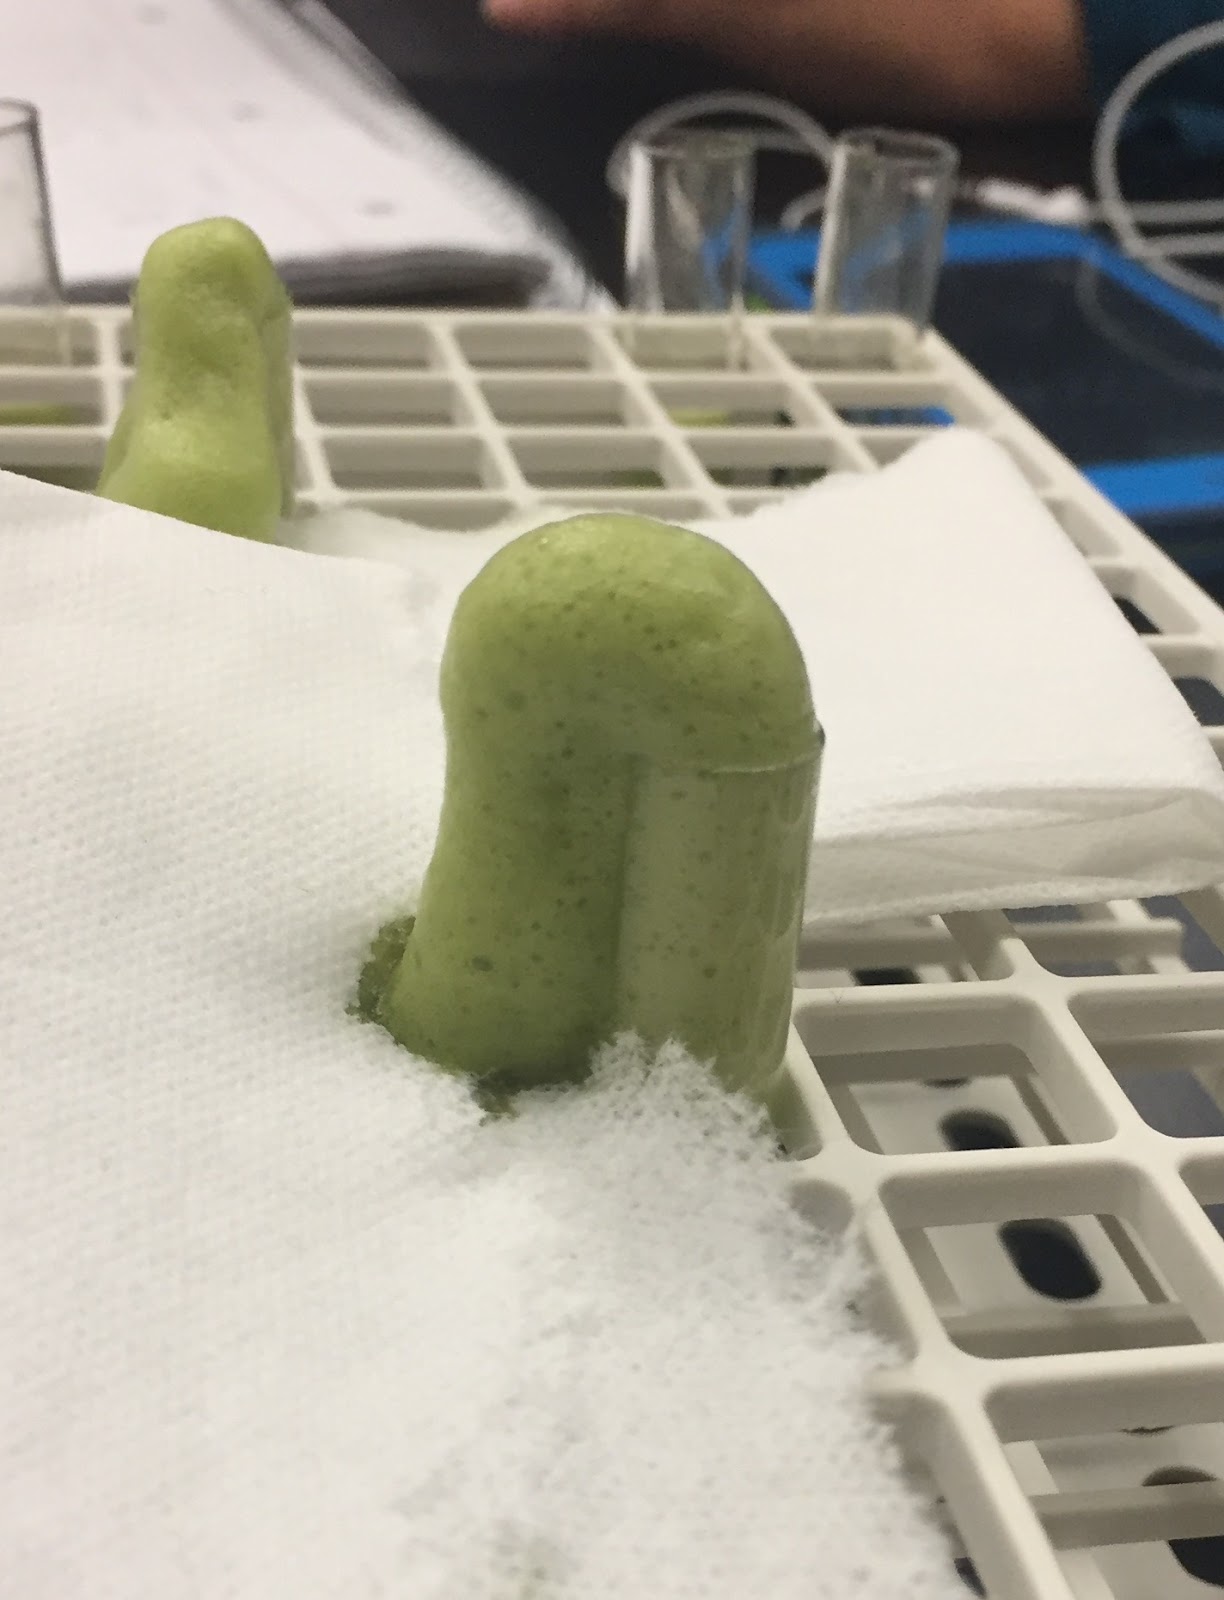 Chart of Froth Growth and Observations With Each Solution
Minutes to height results
|
Control
(just water)
|
3 pH
|
5 pH
|
7pH
|
8pH
|
9pH
|
1 minute
|
1mm
|
no froth
|
.8mm
|
4mm
|
15mm
|
14mm
|
2 minutes
|
7mm
|
no froth
|
1mm, only at edge
|
10mm
|
30mm
|
35mm
|
3 minutes
|
10mm
|
seperation of solutions
|
2mm, thicker at edge
|
15mm
|
45mm
|
60mm
|
4 minutes
|
12mm
|
seperation of solutions
|
3.5mm, full layer ontop
|
22mm
|
55mm
|
70mm
|
5 minutes
|
14mm
|
complete barrier between solutions
|
5mm
|
25mm
|
63mm
|
80mm
|
Data/Results of the Growth of the Froth in Each Solution
Control - 10ml water, 10 ml grass extract, 10 ml 3% hydrogen peroxide
- 1 min : 1mm
- 2 min : 7mm
- 3 min : 10mm
- 4 min : 12mm
- 5 min : 14mm
3 pH - 10ml pH buffer (3), 10 ml grass extract, 10 ml 3% hydrogen peroxide
- 1 min : no froth
- 2 min : no froth
- 3 min : seperation of solutions, no froth
- 4 min : seperations of solutions, no froth
- 5 min : a LOT of seperation
5 pH - 10ml pH buffer (5), 10 ml grass extract, 10 ml 3% hydrogen peroxide
- 1 min : .8mm
- 2 min : 1mm, only at edge
- 3 min : 2mm, thicker at edge
- 4 min : 3.5mm, full layer on top
- 5 min : 5mm
7 pH - 10ml pH buffer (7), 10 ml grass extract, 10 ml 3% hydrogen peroxide
- 1 min : 4mm
- 2 min : 10mm
- 3 min : 15mm
- 4 min : 22mm
- 5 min : 25mm
8 pH - 10ml pH buffer (8), 10 ml grass extract, 10 ml 3% hydrogen peroxide
- 1 min : 15mm
- 2 min : 30mm
- 3 min : 45mm
- 4 min : 55mm
- 5 min : 63mm
9 pH - 10ml pH buffer (9), 10 ml grass extract, 10 ml 3% hydrogen peroxide
- 1 min : 14mm
- 2 min : 35mm
- 3 min : 60mm
- 4 min : 70mm
- 5 min : 80mm
Discussion
After this experiment, we really started to understand how enzymes like the hydrogen peroxidase would react to different types of pH levels. We realised that the higher the pH level, the more likely the froth was going to grow bigger, and faster as shown in our chart and graph. Our hypothesis was if there are different visual reactions with hydrogen peroxide, grass extract and multiple pH solutions, then enzymatic reactions can be dependent upon the pH level. It was supported because based on the pH, the amount of froth varied. We got the results we expected because we precisely measured every solution that was put into each tube was 3 mL, 3 of 1 mL solutions. Our strengths were recording the data and performing the lab, but some of our weaknesses were cleaning the pipes after using them each time, and we accidentally spilled a few of the components in the lab. Next time, we could improve on our cleaning and trying to be more careful around our materials. This is significant to the real world to show how if hydrogen peroxide was in contact with a certain acid or base with a certain pH that was also in contact with our plants, we would notice the different reactions.
Conclusion
In conclusion, our lab was a mix of the unexpected and the expected. Test tubes 8 and 9 surprised us after it continued to overflow. Our group’s prediction was mostly correct except for those test tubes. Perhaps if we use stronger solutions than pH 8 then, a greater reaction will show. It was an overall great learning experience about how these pH levels can have such different outcomes when exposed to grass extract and hydrogen peroxide.
Sources
Bursch, Justin November 21, 2017. Introduction to Cells : Enzymes: Comprehensive List of Instuctional Materials for Enzymes


Comments
Post a Comment